


About every six or seven years, SB&D compares the economies of the four U.S. regions in a feature story. We compare all kinds of economic factors and indicators among the South, West, Midwest and Northeast, including job growth, population, migration, gross product output, unemployment rate. . .you get the picture. So, this is our fourth report in 25 years of comparing the economies of the four U.S. regions and we hope it will assist you in evaluating the best regions of the country for your next expansion.

If job growth is the most accurate way to measure successful economic development, then there is a clear regional winner in America. For decades, no region in the U.S. has been able to compete with the South in the job growth department. The West tries, but the gap between the West and the South in job growth is widening. As for the Northeast and Midwest, the South blew past those two regions way back in the 1970s, and the gap continues to widen with each passing year.
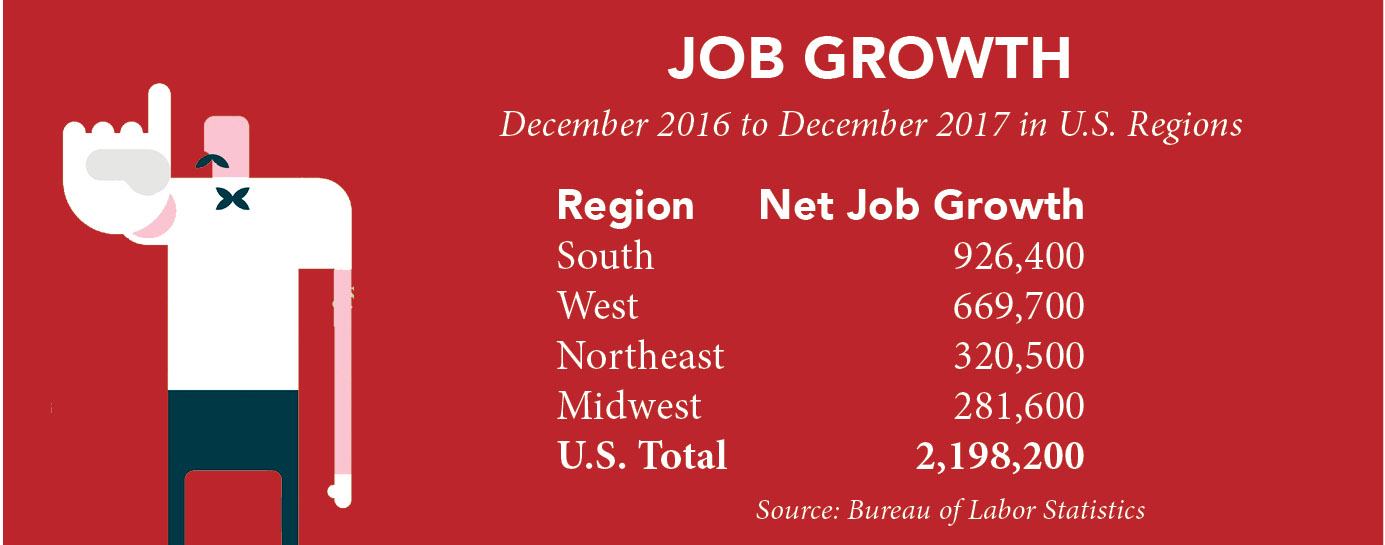
 In fact, in calendar year 2017, the South created 324,300 more jobs than the Midwest and the Northeast combined, which certainly makes sense. The South is seeing well over 1 million people migrating to the region each year from other states. The majority of these folks are coming from the Midwest and Northeast. . .and it’s hard to create jobs when people are moving out of states and there is little population growth, which is certainly the case with the Midwest and Northeast.
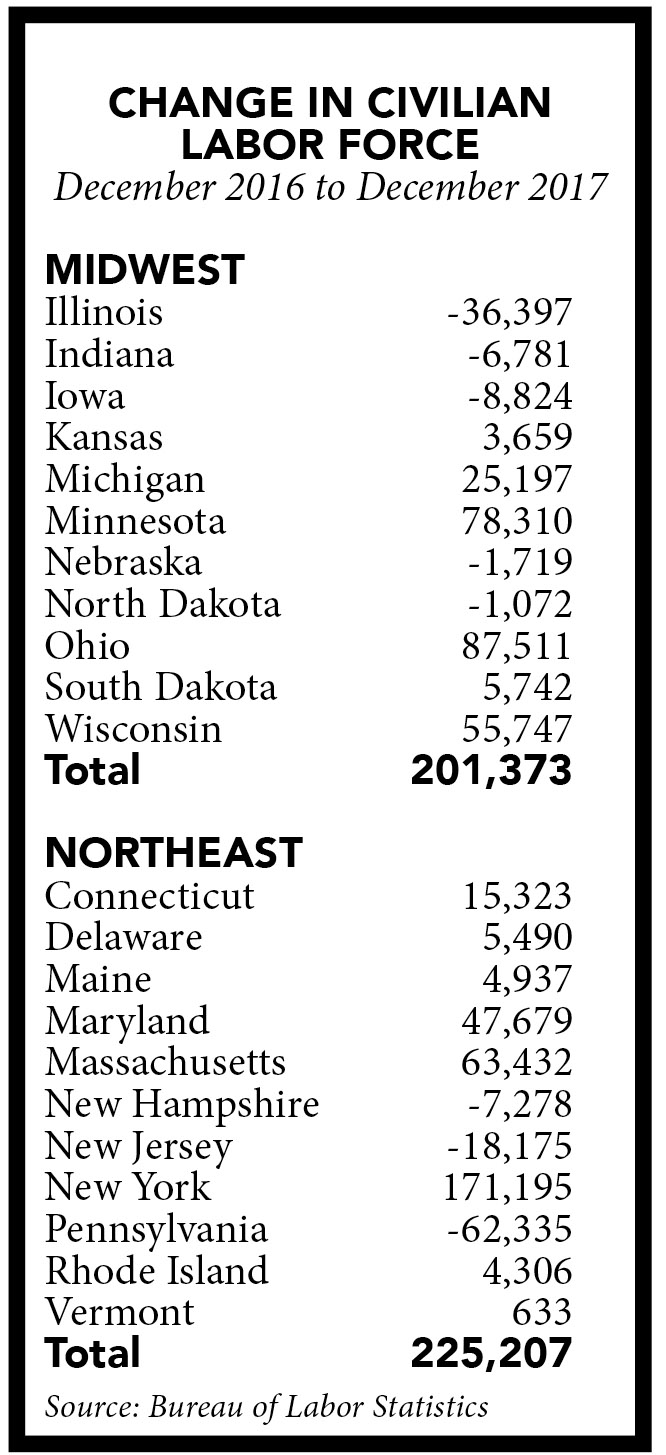
In the Northeast, the only states where the civilian labor force is seeing healthy growth are Maryland, Massachusetts and New York. Pennsylvania’s labor force dropped by 62,335 persons last year alone. New Jersey saw its labor force decline by 18,175 workers in 2017. Of course, all of those people didn’t migrate to the South. The labor force is also affected by retirement, death, birth rate and other factors.
In the Midwest, Minnesota, Ohio and Wisconsin saw healthy increases in their labor forces in 2017, but Indiana, Illinois, Iowa, Nebraska and North Dakota all saw their labor forces decline — Illinois’ by 36,397 — according to the Bureau of Labor Statistics. There is nothing that will slow job growth faster than a labor force that is deflating. Also, migration to states in the Northeast and Midwest from other states is minuscule, with the exception of Minnesota, Ohio, Wisconsin, Michigan, Maryland, New York and Massachusetts. All other states in the Midwest and the Northeast are essentially not growing at all, if not losing members of their civilian labor force. This trend does not seem to be slowing as people, young and old, move to other states in the West and South.
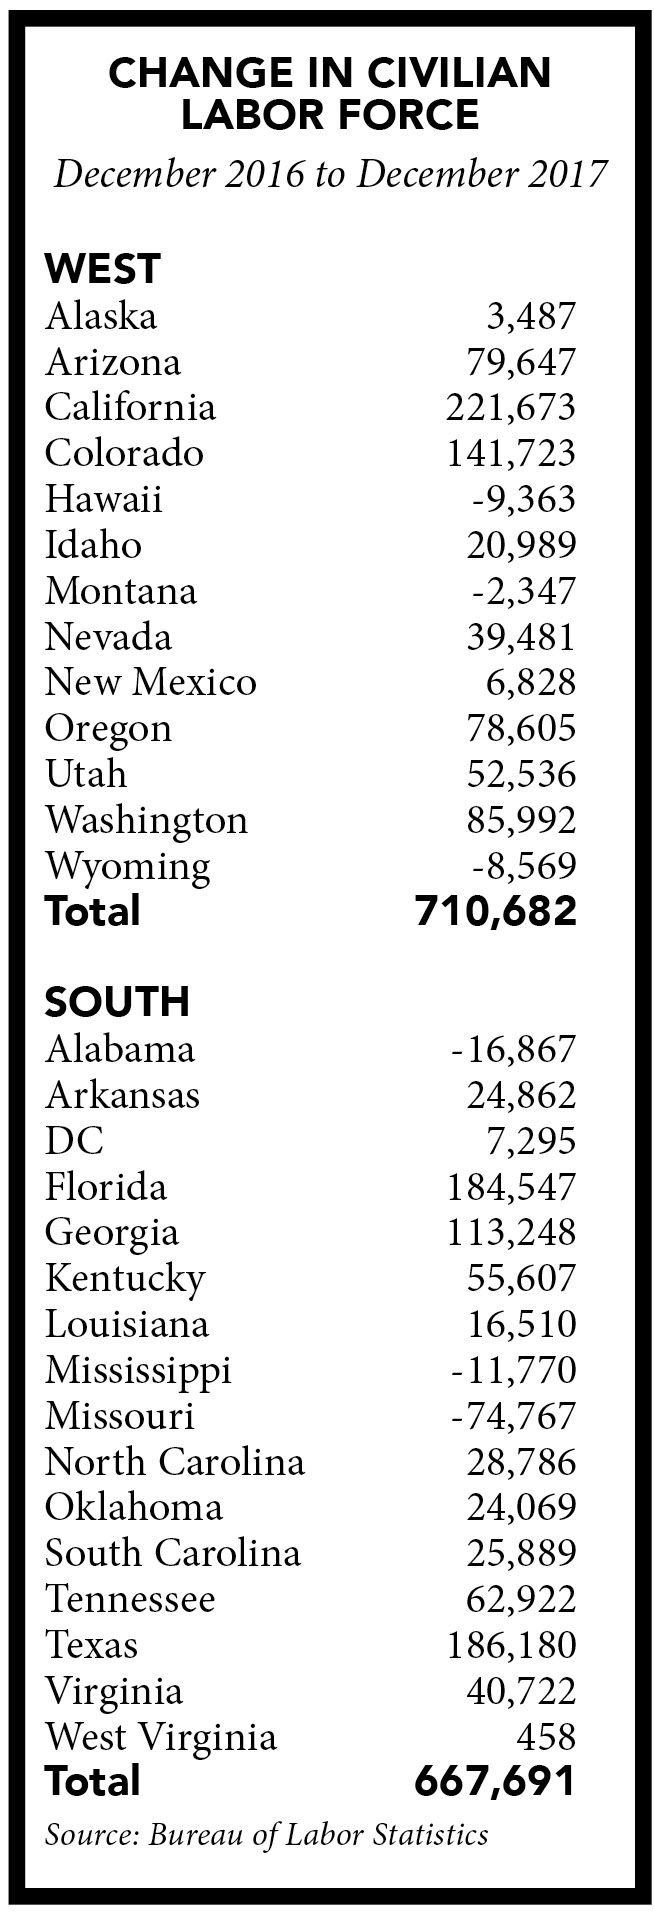
The West saw the largest gain to its labor force with over 710,000 in calendar year 2017, so lots of folks are moving to that region as well. And while we don’t have the data, it figures that birth rates are higher in the West than any other region (all people who turn 16 years of age are additions to the workforce whether or not they are in school or working). In the West region, Colorado and California saw the biggest gains in their labor forces last year, but Arizona, Oregon, Washington and Utah saw impressive adds as well.
In the South, Florida and Texas continue to add large numbers to their workforce. Missouri’s workforce took a huge hit in 2017, losing 74,767 people. It’s also a little concerning that Alabama and Mississippi’s workforce contracted last year.
Even more concerning is that in the South, more jobs are now being created than there are additions to the workforce each year. This is not sustainable. With 926,400 net new jobs created in the South last year and only 667,691 additions to the workforce in 2017, there will be a reckoning at some point. Job growth will slow. . .and that’s true in every region.
 In less than a lifetime, this critical site selection and labor shed factor has changed dramatically among the four U.S. regions. In fact, population variations in the West, South, Midwest and Northeast are most likely the most formidable demographic in American history.
When I was born in the mid-1950s, there were only about 30 million people who lived in the 13 states that make up the West region. Today, California alone is home to almost 40 million people. But you have to go all the way to the 13th and 14th most populated states (Washington and Arizona) to find other states that really contribute to the West region’s population, which today is 78.1 million. The West has grown more than two-and-a-half times in 60 years.
As for the Midwest, Northeast and the South, those three regions in 1957 all had about the same population — between 54 and 56 million. Today, the Northeast is home to 63.6 million people and the Midwest has grown from 55 million people in 1957 to 62 million today. But those figures pale in comparison to growth in the West and South.
 As for the South, 60 years ago it was home to 54 million people. Today, the American South has an estimated 2018 population of 124 million people, or nearly 40 percent of the entire population of the country. So like the West, it has also grown about two-and-a-half times in less than a lifetime. That growth is at the expense of the Midwest and the Northeast since those two regions have barely grown at all, adding just 15 million residents in 60 years combined. That’s about 250,000 more residents per year in the Midwest and Northeast over the past 60 years. The Northeast and Midwest are made up of 22 states. Texas alone adds more jobs per year than the Northeast and Midwest add people.
In comparison, the American South has added 71 million people in 60 years, or almost 12 million new residents on average every 10 years. That’s about five times the cumulative growth of both the Midwest and Northeast totaled together. That’s an impressive 1.2 million people per year being added to the South’s population every year for 60 years on average.
The West, the nation’s second largest region, has added 48 million people in 60 years, or an average of 800,000 per year. In an age of extremely tight labor, it is clear that only two regions of the country are growing; the West and the South. In fact, 60 years ago, the South, Northeast and Midwest all had about the same population. Today, the South’s population is roughly that of the Northeast and Midwest combined.
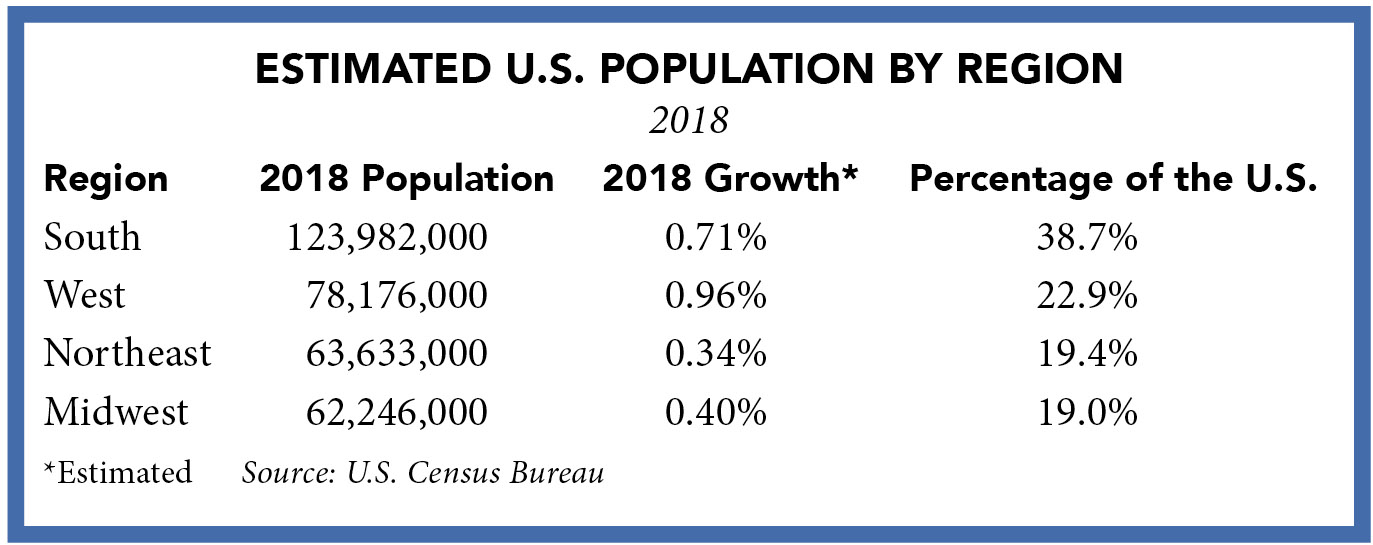
The chart shows population for each region, estimated growth in 2018, and the percentage each region holds of the total U.S. population. Note the estimated 2018 population growth for each region. Not a single region is growing by 1 percent or more. In fact, the U.S. as a whole hasn’t grown its population above 1 percent in any year since 2002. That statistic is a daunting economic development challenge that all of us will face in coming years. In fact, we are already facing the effects of slow population growth as it relates to economic development.
Sluggish population growth is a huge issue for developed countries worldwide, all of which are struggling with low fertility rates. Last year saw the lowest number of women giving birth in the nation’s history. According to data released by the Centers for Disease Control and Prevention, the fertility rate fell to 62 births per 1,000 women ages 15 to 44 in 2017.
The culprit is a significant drop in birth rates for those in their 20s in this country. Data also shows that while birth rates are significantly down for people in their 20s, they are slightly up for those in their 30s, meaning Millennials are most likely postponing having children. Yet, birth rates for those in their 30s are not making up for birth rate losses for those in their 20s.
The birth rate is incredibly important. It measures the demographic health of the country. If the birth rate drops too low, people aging out of the workforce cannot be replaced. It’s even more important considering how many baby boomers will leave the workforce over the next decade. Baby Boomers represent the largest generation in the nation’s history and millions will retire every year for the next 20 years.
Also, if birth rates are down, future tax revenue will be impacted, as will programs like Social Security, which is paid for generationally. The working population today is “paying” for today’s Social Security beneficiaries. You may believe that your Social Security payments over many years are in some kind of deposit box for your use later. Nothing could be further from the truth. Your payments into Social Security paid benefits for the generations before you.
 Considering birth rates are at all-time lows and the sentiment of this administration is to cut immigration, there is no question we are headed for some kind of labor crisis, possibly later this year. . .certainly next year if the economy keeps humming along. Of course, a recession and jobs eliminated by artificial intelligence and automation are the wild cards. Experts’ opinions are all over the place on that subject, so any predictions on job losses tied to automation would be mere speculation at this point.
Experts at the Federal Reserve reported in February that the U.S. is “beyond full employment,” meaning we have many more jobs available, but not enough unemployed individuals to fill those jobs. Now, experts are calling the situation the “body gap,” moving past the “skills gap.” Simply put, there are not enough available people in this country to fill the available jobs.
Noted economist Dr. Nariman Behravesh, the chief economist of IHS, told me late last year there are about 1.5 million unemployed individuals suited for full-time positions in the U.S. There are almost 6 million jobs available in the U.S. And it’s not just low birth rates and reductions in immigration that are straining the labor force. The opioid epidemic — an estimated 2.6 million abusers in the U.S. — is also affecting the workforce.
So, what’s the answer to a labor force gone bare? Well, there are two choices and only two. One is to responsibly increase immigration to about 2 million to 3 million people per year, up from last year’s 1 million, which was the average under the Obama administration. But, the current administration has made it clear it wants to cut legal immigration to 500,000 a year. As it relates to the current labor force, cutting immigration could have grave implications for companies wishing to grow in the U.S.
An increase in responsible immigration is an immediate fix for the labor crisis that we are about to endure. In fact, many companies are already feeling the labor crunch effect. Tech companies — huge users of immigrant labor — have 1.5 million jobs that cannot be filled now.
Of course, the long-term fix for our labor issues are higher fertility rates and birth rates. There are no other solutions. None. Zero. Zippo.
In December, House Speaker Paul Ryan said, “This is going to be the new economic challenge for America: People. We have to have higher birth rates in this country. We have something like a 90 percent increase in the retirement population but only a 19 percent increase in the working population in America. So what do we have to do? Be smarter, more efficient, more technology. . .still going to need more people,” Ryan said.
Yes, we are in a baby bust and there are no signs that tell us it will end anytime soon. Apparently Millennials believe they cannot afford children, or at least multiple children.
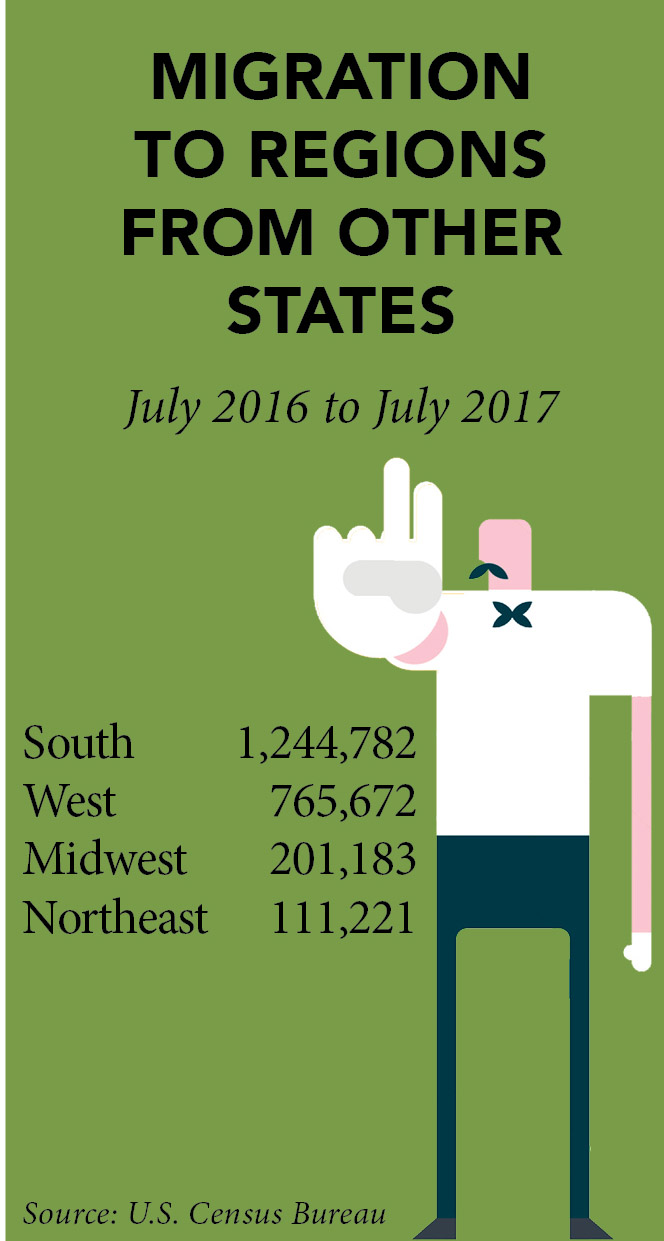
However, there is some good news in the demography department for the South and for companies that want to establish a presence in the region. Recent data shows the influx of new residents to the South is back to normal — which has been over 1 million new residents on average every year for the past 60 years — after several years during and after the recession of low migration numbers. For the most part, those low migration numbers from 2007 to 2012 centered on the fact that folks up North couldn’t sell their homes. For most of us, if you can’t sell your house, you’re not moving.
U.S. Census data that came out in the winter quarter showed a huge influx of new residents in the South from other states outside the region. Between July 1, 2016 and July 1, 2017, the South added 1.24 million additional residents that came from other states, well above the second-fastest growth region — the West — with its migration increase of 765,672 people. The Midwest saw meager gains of only 201,183. The Northeast saw an increase of just 111,221 residents.
The migration patterns from 2016 to 2017 as calculated by the Census Bureau are essentially the average population gains that the South has seen over the past 60 years. Yet, migration to the Northeast and Midwest has dropped like a rock since we did this report seven years ago.
In terms of population gains and migration gains from other U.S. states, Texas and Florida dominate the South. As written, the U.S. as a whole has not seen 1 percent growth in population since 2002. However, Census estimates show that Texas, Florida, Georgia, North Carolina, Tennessee, South Carolina and Washington, D.C., will grow by over 1 percent in 2018.
No states in the Midwest or Northeast are expected to grow by 1 percent or more in 2018, however, two states in the West are expect to grow by almost 2 percent — Nevada and Utah. Other states in the West expected to grow by 1 percent or more this year include Washington, Colorado, Oregon and Arizona.
 As written, according to the Federal Reserve, the U.S. is now beyond full employment. When reporting job gains or job losses, the Bureau of Labor Statistics typically goes by net gains or losses. Since the recession ended, we have created more than 2 million jobs every year but one. Last year — President Trump’s first — the U.S. created almost 2.2 million net new jobs. That total is a little behind President Obama’s average. Obama’s best year was 2014 when the U.S. created nearly 3 million net new jobs.
However, the bigger picture isn’t the net job gains or losses but the gross job numbers. For example, in 2017, there were approximately 30 million gross jobs created, with a net gain of 2.2 million jobs. That means there was a gross loss of almost 28 million jobs.
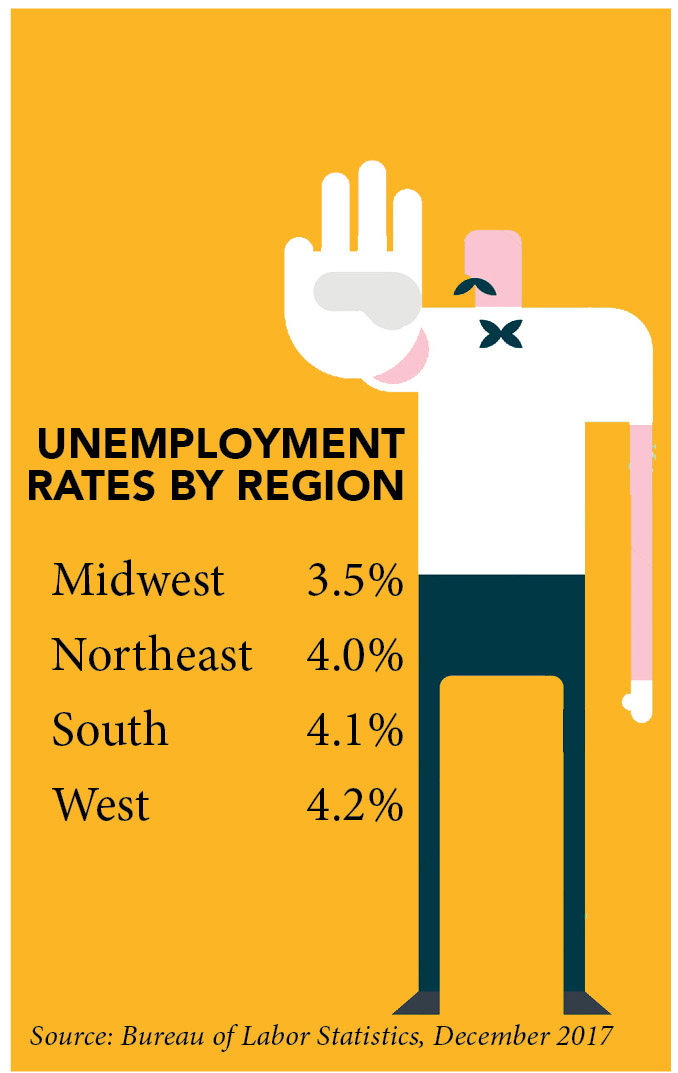
As mentioned, we are facing a double whammy to the labor market — tight immigration policies and lower birth rates seen for more than 15 years. It isn’t too surprising that job growth is beginning to slow considering the unemployment rate, near 4 percent, is beyond full employment.
As a result of the lower birth rates seen since 2002, the U.S. population today provides anywhere from 60,000 to 75,000 people entering the job market per month (turning age 16). For decades, the U.S. could count on about 175,000 to 225,000 people entering the job market per month. But with a declining labor force, population and immigration, along with full employment, job growth will most certainly slow, unless those 28 million lost gross jobs last year increase, freeing up labor that was previously employed.
At the end of the year, all U.S. regions were at or beyond full employment. In 2009, when “the new normal” seemed to be soaring job losses, who could have predicted that nine years later the nation would be at full employment?
Well, after a recovery that’s the second longest in U.S. history, the new normal is, “The economy is too good. There’s no labor left.” By the way, that is a good and bad thing. Full employment is the goal of any economy and we’ve reached it in just about in every corner of the nation. But when you reach full employment, growth is hard to come by. What goes up must always come down.
 Gross product output is very interesting to watch as the South’s is pulling away from all other regions. In 2016 (latest data available), the 15-state American South contributed a record $6.62 trillion (that’s with a “T”) to the United States’ economy, which saw a GDP totaling $18.57 trillion. The South’s figure represents well over a third of the nation’s output. The West contributed $4.61 trillion, which was more than any other region other than the South. Take California out of the West, and its GDP totals a mere $2 trillion.
California, by the way, is killing it right now. As always, when the national economy is humming, so does California’s. Who cares if it costs more than double any other state in the South to operate a business there, when you are making money hand over fist? California’s economy collapses during recessions. It always does simply because it is the most costly state to live, work and own a business in the U.S. When times get tough, California businesses ask, “Now, why are we spending so much money to live and operate here, when we can go to Texas for half the cost?”

Back to gross product. The complete blowout of the South’s gross product in 2016 means the region is no longer the fourth largest economy in the world. The South has been the fourth or fifth largest economy in the world based on GDP for more than 25 years. In 2016, the South blew past Japan and Germany with a gross product that is more than half the size of China’s.
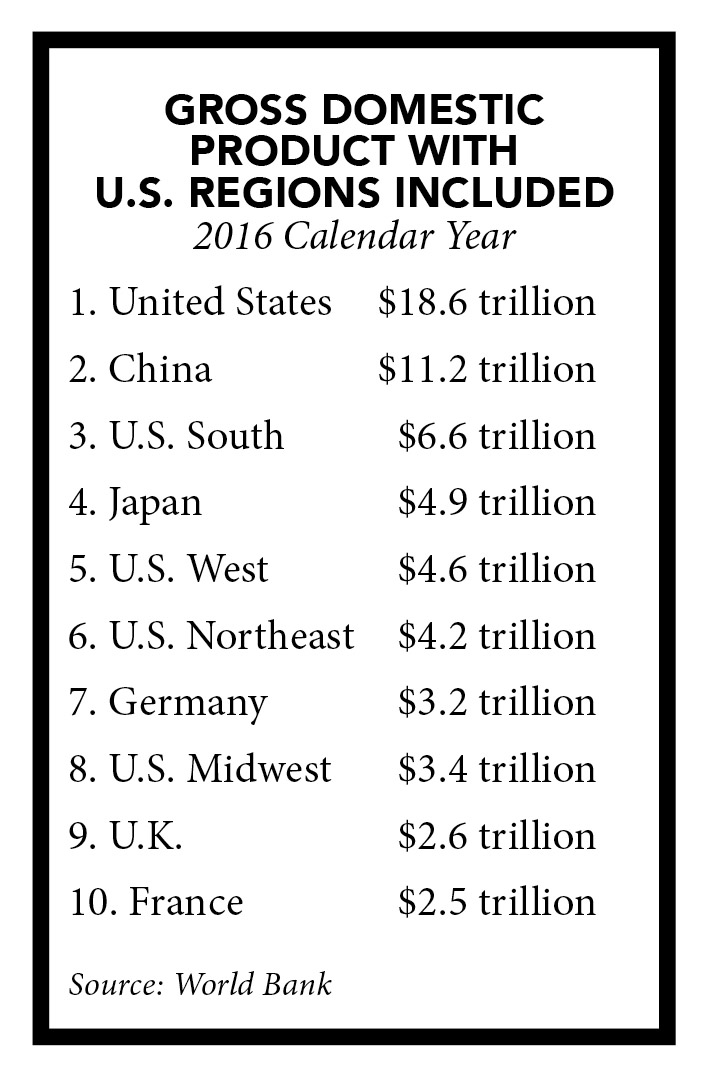
Shown at right are the top 10 economies in the world, with regions of the U.S. factored in when it comes to GDP in 2016. The values are based on U.S. dollars.
The last time we ran this story comparing the economies of the four U.S. regions, Boeing was not set up in South Carolina or Airbus in Alabama. In terms of adding to gross product and exports, aerospace is a huge player in the South. It is the largest export for most Southern states.
Also, the last time we ran this story we were in recession. The South’s automotive industry was in the tank, as was the region’s financial services industry. Today, those two huge Southern sectors are at the top of their game. So, it isn’t any wonder that total output in the South is at all-time highs at $6.6 trillion. Never before has any U.S. region reached the $6 trillion output threshold. The South is pushing for $7 trillion today.
There are several ways the South achieved its rise to third place in 2016. It has diversified its economic base like no time ever. Its in-migration from other U.S. regions is back to levels not seen since the 1980s, 1990s and before the Great Recession. Well-educated immigrants from other countries now want to live in the South as opposed to other regions because the South remains the least expensive place in the U.S. to live and operate a business.
Furthermore, the South is unlike any of the other three regions in this very important demographic: No U.S. region has the number of mid-major markets the South has — Austin, San Antonio, Raleigh, Charlotte, Nashville, Orlando, Memphis, Knoxville, Charleston, New Orleans, Richmond, Birmingham, Jacksonville, Louisville, Greenville and so many others. The region is home to mega-markets such as Atlanta, Dallas-Fort Worth, Houston, South Florida and D.C. But it is the vast number of mid-majors that solidify the South’s economy and help spread the wealth. Want proof? Name a major market in Illinois other than Chicago? Name one in New York? In contrast, Florida and Texas have 10 mid-majors each.
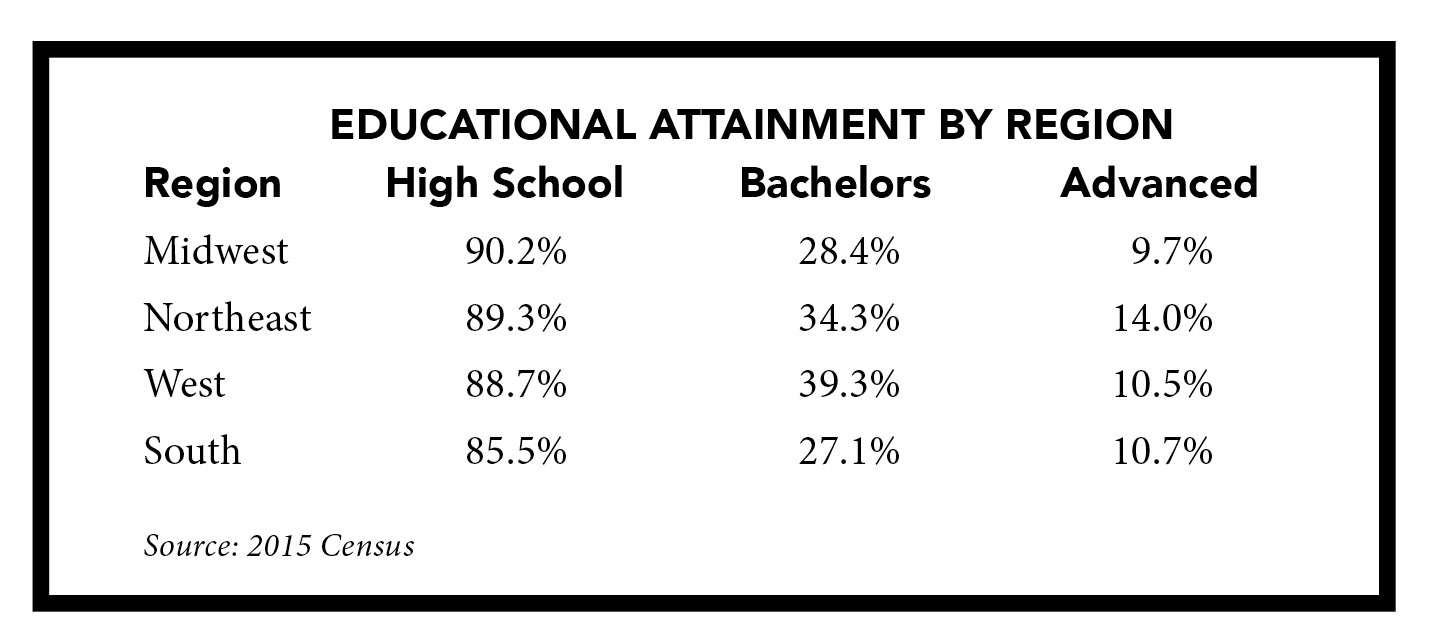
While the South’s economy is now the third largest in the world, the region’s educational attainment remains behind all three other regions. For the first time in history, one in three adults (33 percent) held a bachelor’s degree or higher in the U.S., according to the 2015 Census. Also found in that census was that almost nine out of 10 adults in the U.S. (88 percent) had a least a high school diploma or GED.
It should be noted that Texas and California had the lowest high school graduation rates (81.9 percent and 79.8 percent). States in the South with the highest educational attainment rates are Missouri, Virginia, Oklahoma, Florida and North Carolina. All five states are above the U.S. average in educational attainment.
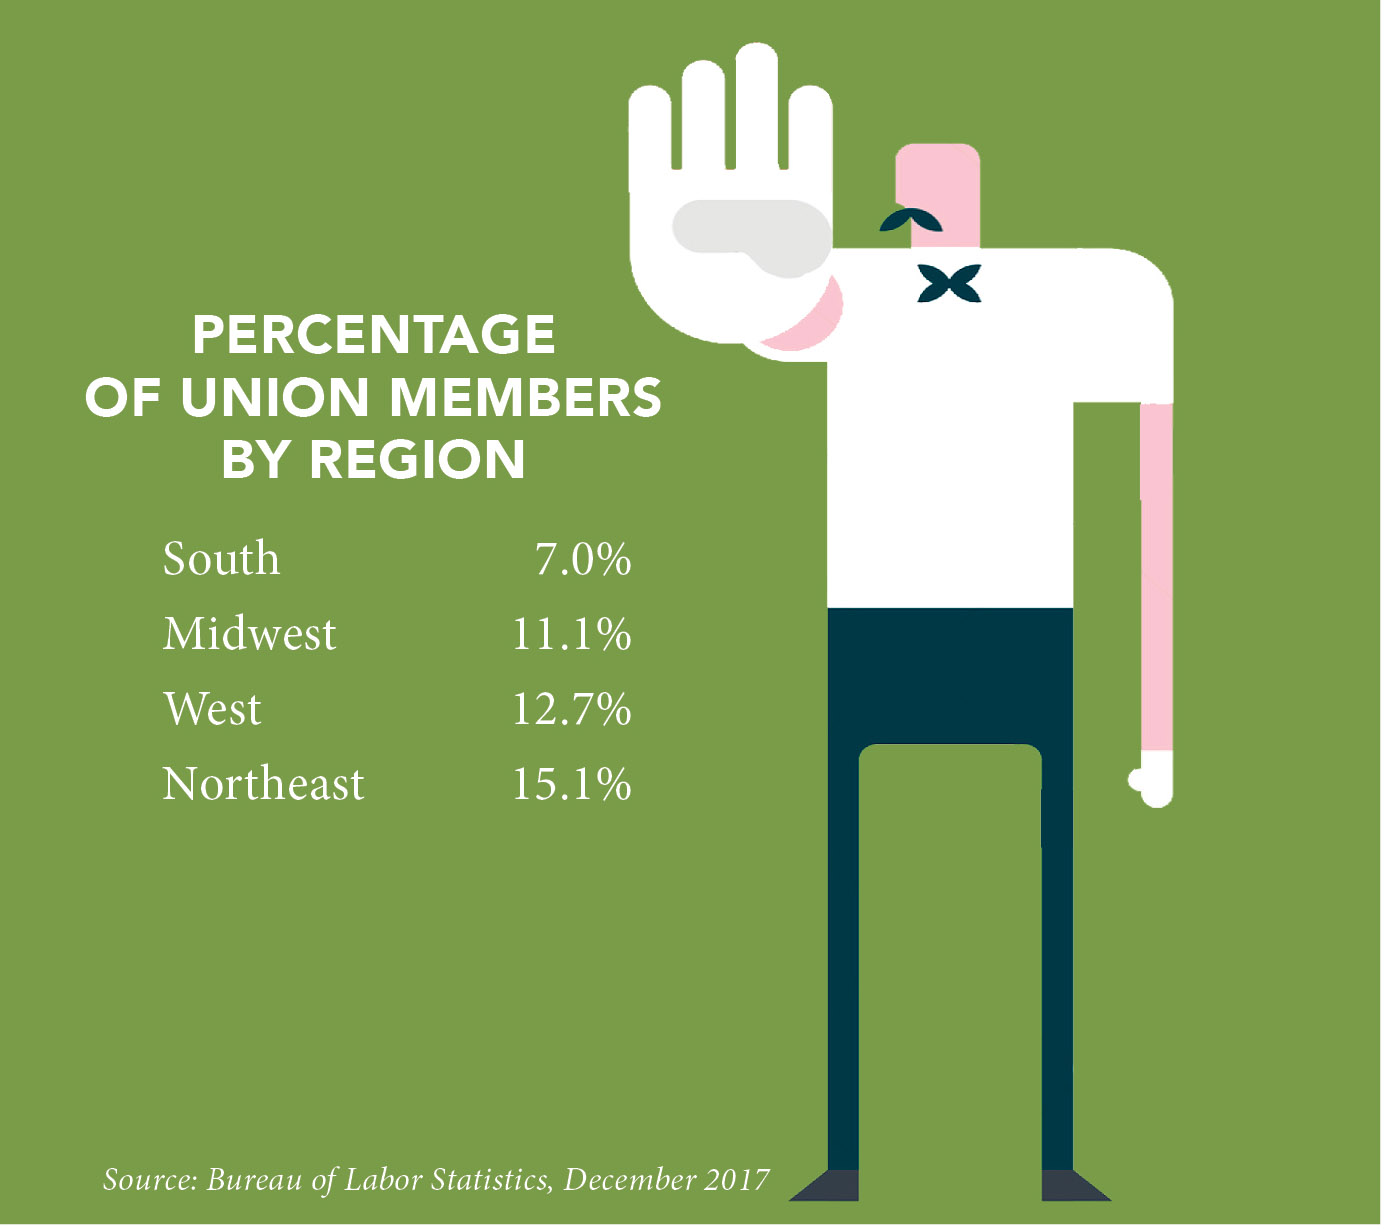 In early 2017, both Kentucky and Missouri passed Right to Work laws. A Right to Work law secures the right of employees to decide for themselves whether or not to pay dues to support a union.
So, today, all states in the South have passed Right to Work legislation. There are now 28 states in the country with Right to Work laws.
We hope this report and its data on the current economic state of U.S. regions is helpful in your site search. You can get more information on our websites SB-D.com, SouthernAutoCorridor.com and RandleReport.com.


Southern Business & Development
8086 Westchester Place
Montgomery AL 36117
205.871.1220
| SECTIONS | MAGAZINE | OTHER NEWS |