


Another year of monitoring economic development project activity in the South — the world’s third largest economy — clearly shows that this last 10-year recovery that ended in the spring of 2020 thanks to the pandemic (the longest recovery on record), peaked in 2015 or 2016. SB&D doesn’t judge an economy as an economist does, using real time data such as job creation, GDP, worker productivity and unemployment rates, even though unemployment rates are incredibly important in economic development. We look at the economy in just one way — economic development project activity broken down by how many manufacturing and service projects were announced in the region each calendar year.
To judge where the economy is and how it is performing, we count the number of projects meeting or exceeding 200 jobs and/or $30 million in investment announced in the South each year. We use projects submitted by each of the 15 states’ economic development agencies and back that up with announcements published on our fantastic news aggregator site, RandleReport.com.
We call it the SB&D 100 because we publish the top 100 job and investment projects announced the previous calendar year. Ranking the top 100 announced projects creates a threshold for both rankings, and that threshold is the 100th largest project. So, any project of 200 jobs or more and/or $30 million or more in investment up to the 100th largest project earns a state or community five points. If a project lands on either SB&D 100 ranking — jobs or investment — it earns 10 points. In other words, we give larger projects more points, so the ranking is weighted.
We count the points in each market category: rural (less than 50,000 in population), small market (50,000 to 249,999), mid-market (250,000 to 749,999), major market (750,000 to 2.49 million) and mega-market (over 2.5 million in population). Based on points earned, we also rank states. However, while markets are ranked among their peer groups by points exclusively, on the state level, those recognized are the highest point earners based on points per million persons, or points per capita. If we did not rank states on points earned per capita, Texas would win every year based on points alone, and that’s no fun.
This method of judging the economy makes sense if you think about it. Companies looking to expand production capacity — services or manufacturing — employ experts that can see around corners. These experts — economists or not — usually have an accurate opinion on what the economy will be doing in six months, a year, or three years, depending on how long the project will take to complete. Every year is different and this, the 2021 SB&D 100, happened to occur during a pandemic for the first time ever.
If there was ever any doubt, the pandemic proved that Americans love their pets. People flocked to animal shelters to adopt, and the pet industry hurried to keep up with demand: Chewy in Richardson, Texas; Fresh Pet in Ennis, Texas; Nestlé Purina in Hartwell, Ga., and Rockingham County, N.C.; all made the SB&D 100.
After the 2001 recession during George W. Bush’s first year as president, Southern Business & Development ran a cover story titled, “So, how bad was it?” SB&D’s answer to the question was something like, “Man, the 2001 recession could have been so much worse.” Thankfully, it wasn’t nearly as bad as the next recession, the Great Recession of 2007-2009, which I have described multiple times as a “financial disaster.”
Yes, we saw economic development projects drop dramatically 20 years ago, or the year of 9/11 and one year removed from the Y2K scare (remember that?). In the fall quarter of 2001, in the few months after 9/11, there were fewer deals recorded in the South than any quarter in SB&D 100 history, or since 1993. In the years of 2001 to 2003, after several years of the go-go 1990s with no year falling to project totals below the 500 level, economic development projects in the South meeting of exceeding our thresholds of 200 jobs and/or $30 million in investment fell into the 400s.
This year, too, for the first time since 2008, project totals in the 2021 SB&D 100 dropped below the 500 mark (but just slightly) at 497. Again, not nearly as bad as we were thinking or projecting. It could have been and should have been so much worse. The 10-year recovery of the economy from the Great Recession clearly peaked in 2015 when the 15-state American South announced 730 projects of 200 jobs or more and/or an investment of $30 million. That year holds the record for number of deals announced meeting our thresholds in the South after almost 30 years.
This is what we faced in the beginning of the pandemic — a shutdown of most businesses
During the last two weeks of March 2020, the U.S. economy saw nearly 10 million new unemployment claims, a total never seen ever. Yep, in just two weeks. As the pandemic raged on in April, business closures and layoffs spiked to the highest level in U.S. history. Higher than in World War II, worse than World War I and any other catastrophe this nation’s economy has suffered, including the Great Depression.
Incredibly, total non-farm payroll employment fell by 20.5 million in the U.S. in April of 2020. Peak weekly unemployment claims occurred the week of March 28, when 6.9 million filed for first-time unemployment assistance.
To give you an idea of what a massive crater that 6.9 million was in unemployment claims, the peak week prior to March 28, 2020, was 650,000 claims in 2008 during a week in the Great Recession. That was in one week. So, ten times the previous peak in unemployment claims in the U.S. occurred in March of 2020. Pretty bad, huh? Yes, but it got worse.
By the start of the second quarter of last year, the economy was in a deep dive. In less than 60 days, the U.S. found itself in a wide-ranging recession. The long 10-year recovery from the Great Recession was history. Nada. Gone forever all because of the virus, or the U.S. government’s response to it at the start.
The coronavirus pandemic, as it was defined by the WHO at the end of the first quarter, triggered the deepest reduction in gross domestic product in the nation’s modern-day history. Again, the longest economic expansion in the U.S. — 113 consecutive months of job growth that began in June 2009 — was over by the end of the first quarter of last year, and it got worse by the second quarter of 2020.
Gross domestic product — easily the best method of judging an economy — fell by an enormous annual rate of 32.9 percent in the second quarter of 2020. That is more than three times the previous annual record of GDP decline, which was a 10 percent drop in 1958. On a quarterly basis, the 9.1 percent drop in GDP in the second quarter of 2020 was more than triple the previous high of 3 percent since records first began.
In the second quarter, the consumer economy ground to a halt as retailers and almost everything in the service economy shut down in an effort to slow the spread of the virus. In an NPR article published in July, chief economist at IHS Markit, Nariman Behravesh, called the enormous downturn in GDP in the second quarter “horrific.”
There were some economic bright spots as early as April 2020. It should be noted that U.S. retail sales increased by 17.7 percent from April to May, the largest monthly increase in U.S. history. But that increase was simply because some inroads were made in retail openings after a total collapse of closures in March. Ghost towns were everywhere.
But, keep in mind that personal stimulus checks were being received in April and May as well as small business Paycheck Protection Program checks. Called the CARES ACT, the first round of federal aid totaled over $2 trillion, more than doubling the stimulus of the Great Recession.
By the start of the fall 2020 quarter, the pandemic had claimed more lives than those lost in the Vietnam War (Source: Ducharme 2020; authors’ calculations). By then, however, the deaths were slowing despite the fact that some states lifted social distancing restrictions in the summer. By September 7, 2020, there were only 23,500 new cases of COVID. By the end of October, those cases had quadrupled. Probably as a result of more people being allowed into businesses.
By the end of January of this year, over 300,000 cases a day were occurring, the highest since the pandemic began. At the same time, the first of the vaccines were administered. Not many at first, but by May 2021, new cases dropped below 10,000 as a result of the multiple vaccine programs. By the end of May, about 40 percent of the U.S. population had been fully vaccinated.
While many believe that President Biden signed the second stimulus of another $1 trillion or so to head off the economic crisis caused by the pandemic, it was actually President Trump. This round of loans (that most will not repay) really jump-started the economy at the beginning of January. Then Biden signed another round of stimulus spending — this worth $1.9 trillion — in March.
The effectiveness of these stimulus programs (or you can call them bailouts) won’t be seen until the money runs out, and that is going to be at least another year. If the recession was caused by the pandemic or something else (it is my opinion we were already headed for recession in 2018), then most agree that this large federal assistance plan was required for the economy to get on its feet. . .and it did.
So, today, you find states with the same unemployment rates that they had prior to the pandemic. But without nearly
$5 trillion in aid, there is no question in my mind the COVID recession would have lasted much longer.
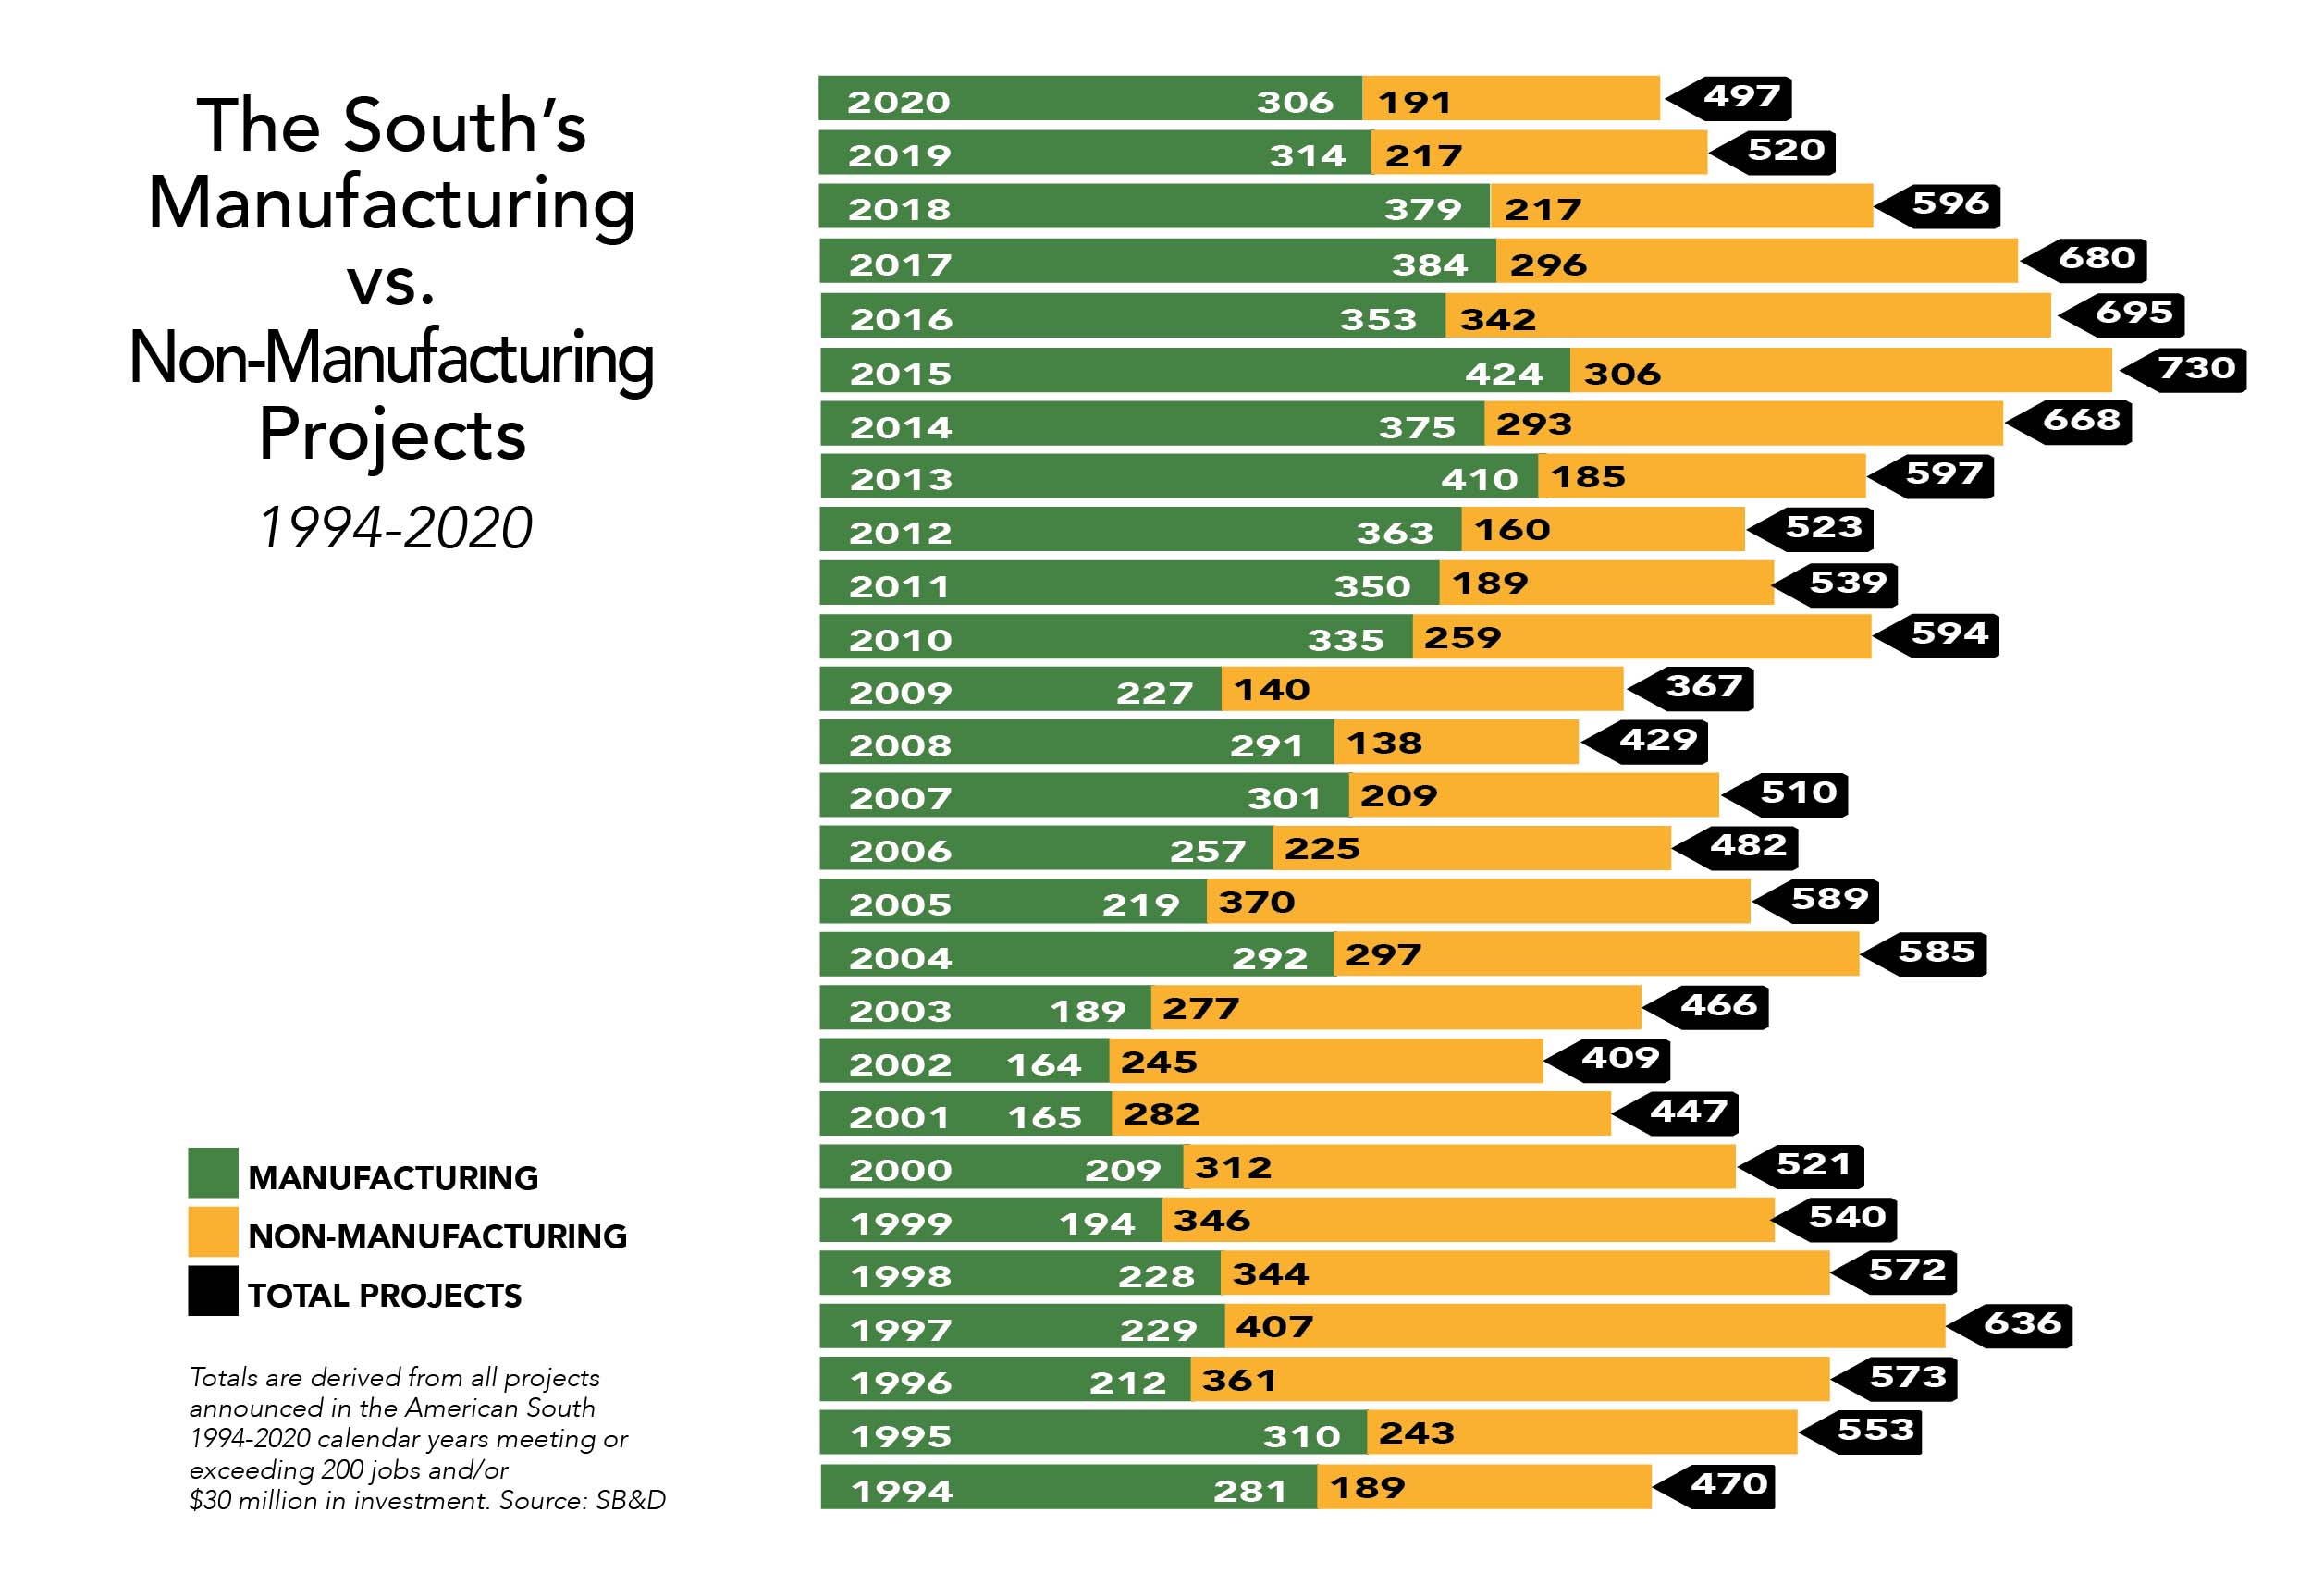
With well-known economists like Nariman Behravesh using the word “horrific” to describe the economic environment in calendar year 2020, how did project activity fare in the South? To be honest, not too bad, for deals announced in a “horrific” pandemic. Yet, the 2021 SB&D 100, with 497 projects meeting or exceeding our thresholds, does represent the fifth consecutive year of falling project totals as you can see by the chart on the opposite page.
Unlike the Great Recession more than a dozen years ago, where no industry sector went unscathed including the South’s three largest industries — automotive, distribution and financial services — the COVID-19 recession was so unique that it actually created several opportunities for some regarding project activity. With almost everyone at home for much of the year — working at home, schooling at home — online spending just exploded.
To prove that, our data shows that Amazon announced 10 projects in calendar year 2020 in the South — not the nation — with almost 18,000 jobs and a total investment of $1.4 billion. That is an unheard-of total. No company has come close to earning 10 deals on any SB&D 100 in one year. Amazon announced 10 large projects in the middle of a pandemic.
2021 SB&D 100: Manufacturing vs. Services
Even with the pandemic in calendar year 2020, project totals making our thresholds stayed much the same from 2019 to 2020. There were 306 manufacturing projects making the “100” this year and 314 last year. Both years saw 191 big service deals, but with 10 coming from one company — Amazon — services actually had a terrible year. Of course, it was services that got slammed during the pandemic in 2020.
Manufacturing has pretty much dominated service projects for years now. In the 1990s that certainly wasn’t the case. The 1990s saw the U.S. evolve into a services economy, much of it centered on the birth and maturation of the internet. The U.S. wasn’t nearly as competitive in the manufacturing arena, as some years saw services doubling manufacturing in large deals. More than any other time over the last 30 years, the 1990s saw U.S. manufacturers making a beeline to
China in a herd mentality. That has completely reversed for more than a dozen years now.
Look at the years 2007 to 2020. Manufacturing has dominated services in big economic development projects in the South. Why? That is easily answered. The South essentially became the most competitive region in the world to make something, particularly for U.S. consumption.
As manufacturing and labor costs soared in China and Mexico, the cost of doing business in the South actually dropped as the natural gas boom made the South incredibly competitive with other countries, even China. Around 2010, the term “reshoring” was invented. Economics after the Great Recession made it cost-effective to repatriate your plant back to the South, the least expensive place in the largest economy in the world to manufacture goods.
There are some red flags flying with this SB&D 100 regarding some industry sectors. As mentioned with Amazon’s 10 projects, distribution for the second year in three years was your No. 1 industry with 80 large projects. That figure represents the best distribution has done in 28 years.
But automotive could only muster 40 deals, when in 2015 it produced 111 large projects. Financial services, always the canary in the coal mine, only put up 11 projects when that sector produced 69 in 2015.
In addition to distribution, the industries that did well in the 2021 SB&D 100 were food and beverage, life sciences, data centers and IT. Those that struggled include automotive, aerospace, healthcare and metals.
Some outstanding projects were announced in 2020 including a rare semiconductor deal in Richardson, Texas, and an Amazon air freight hub with 2,000 jobs in Northern Kentucky.
All-in-all, we here at SB&D feared the worst. We feared that because of the pandemic, total projects meeting or exceeding 200 jobs and/or $30 million in investment could easily have set the low mark — below the 367 deals announced in 2009.
Yet, both presidents — Trump and Biden — as well as both political parties stepped up with huge monetary initiatives and incentives to keep employers paying employees, keep businesses open and keep folks paying their rent and mortgages with an unprecedented number of aid packages that the U.S. has never applied in its history.
These aid packages put so much money “on the street” that for now, we have come back from the worst economic collapse in American history.
Others will say the debt created to emerge out of the virus recession cannot be sustained. That is debatable. Even before the pandemic, 50 cents of every dollar of U.S. expenditures went to interest servicing that debt alone. Yet, the dollar is the world’s currency and the U.S. controls its own currency.
So, what did we do? We printed so much new money — under both administrations — that we bought our way out of the pandemic recession. Bad thing? Good thing? We will see, but in the short term, it can only be described as a necessary thing.
So, how bad was it? In terms of large project activity in the South during a pandemic, we’d give it a “B.” That’s not so bad.


Southern Business & Development
8086 Westchester Place
Montgomery AL 36117
205.871.1220
| SECTIONS | MAGAZINE | OTHER NEWS |